Rents: €17.17/sqm is the new benchmark
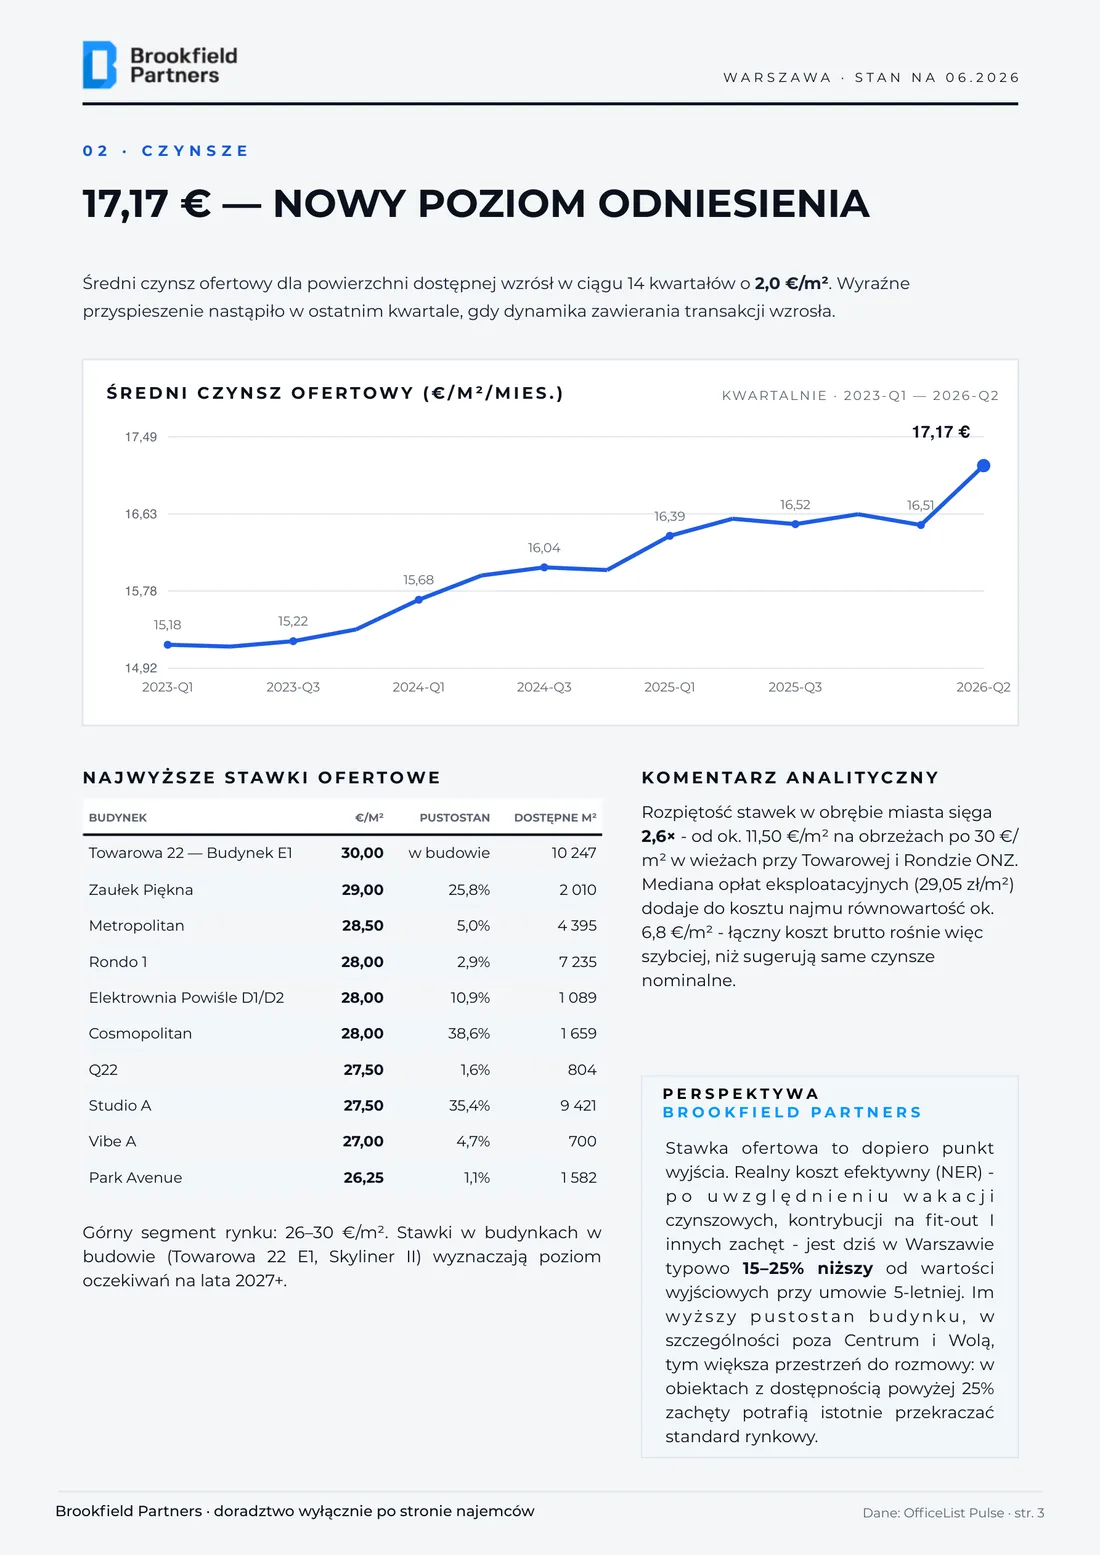
The average asking rent for available space rose by €2.0/sqm over 14 quarters, accelerating sharply in the last quarter - from €16.51 to €17.17/sqm. Limited new supply keeps pushing rates up. The top segment sits in the €26-30/sqm range.
Average asking rent (€/sqm/month), quarterly
| Quarter | 2023 Q1 | 2023 Q3 | 2024 Q1 | 2024 Q3 | 2025 Q1 | 2025 Q3 | 2026 Q1 | 2026 Q2 |
|---|
| €/sqm | 15.18 | 15.22 | 15.68 | 16.04 | 16.39 | 16.52 | 16.51 | 17.17 |
Highest asking rents
| Building | €/sqm | Vacancy | Available sqm |
|---|
| Towarowa 22 - Building E1 | 30.00 | under constr. | 10,247 |
| Zaułek Piękna | 29.00 | 25.8% | 2,010 |
| Metropolitan | 28.50 | 5.0% | 4,395 |
| Rondo 1 | 28.00 | 2.9% | 7,235 |
| Elektrownia Powiśle D1/D2 | 28.00 | 10.9% | 1,089 |
| Cosmopolitan | 28.00 | 38.6% | 1,659 |
| Q22 | 27.50 | 1.6% | 804 |
| Studio A | 27.50 | 35.4% | 9,421 |
| Vibe A | 27.00 | 4.7% | 700 |
| Park Avenue | 26.25 | 1.1% | 1,582 |
The spread within the city reaches 2.6x - from about €11.50/sqm on the outskirts to €30/sqm in the towers near Towarowa and Rondo ONZ. The median service charge (29.05 PLN/sqm) adds roughly €6.8/sqm to occupancy cost, so the gross cost rises faster than headline rents suggest.
Brookfield Partners perspective. The asking rent is only a starting point. The effective rent (NER) - after rent-free periods, fit-out contributions and other incentives - is currently 15-25% below headline figures on a 5-year lease. The higher a building's vacancy, especially outside the core and Wola, the more room there is to negotiate; above 25% availability, incentives can materially exceed the market standard.
Vacancy and availability: the deepest absorption in the cycle
Ready-to-occupy space fell to 572k sqm - 89k sqm less than a quarter earlier and 172k sqm less than a year ago. The market dropped below the 9% vacancy threshold for the first time in years, and the decline is highly uneven geographically.
Vacancy rate and available space, quarterly
| Period | 2023 Q1 | 2024 Q1 | 2025 Q1 | 2026 Q2 |
|---|
| Vacancy | 11.1% | 10.1% | 10.2% | 8.6% |
| Available space | 819k sqm | ~640k sqm | ~620k sqm | 572k sqm |
Largest concentrations of vacant space
| Building | Location | Class | Rent | Vacant sqm |
|---|
| Horizon Plaza | Mokotów | A | €13.50 | 18,517 |
| Łopuszańska Business Park CD | Ochota/Włochy | B | €13.25 | 14,122 |
| Vena / Prymasa Office | Wola | A | €19.50 | 11,441 |
| Allianz | Mokotów | B | €13.75 | 9,977 |
| Domaniewska Office Hub | Mokotów | A | €14.50 | 9,796 |
Subleases - hidden supply by district (sqm)
| District | Mokotów | Wola | Śródmieście | Włochy | Ochota | Praga-Płd. | Żoliborz | Ursynów | Praga-Płn. |
|---|
| sqm | 19,404 | 17,261 | 14,134 | 5,276 | 4,250 | 1,617 | 350 | 286 | 234 |
In total, 62.8k sqm of sublease space (outside official vacancy) is concentrated in Mokotów, Wola and Śródmieście. Sublease is often 20-40% cheaper than direct leasing and signals where tenants are reducing their footprint.
Brookfield Partners perspective. Real supply for a tenant = vacancy + sublease + move-outs within a 12-month horizon. Measured this way, availability is about 11% higher than the official rate.
Districts: two speeds of one city
Three districts - Wola, Śródmieście and Mokotów - hold 71% of the stock, but they are two different markets. In the core, vacancy is below 6% and rents are €20-26/sqm; in the southern and western business areas, availability is double-digit and rents are €14-16/sqm.
Warsaw office market by district (as of 06.2026)
| District | Buildings | Stock (sqm) | Vacancy | Vacancy (sqm) | Sublease (sqm) | Rent (€/sqm) | Service (PLN) |
|---|
| Wola | 98 | 1,648,722 | 5.39% | 88,793 | 17,261 | 20.06 | 31.00 |
| Śródmieście | 147 | 1,634,068 | 5.69% | 92,922 | 14,134 | 21.78 | 34.00 |
| Mokotów | 119 | 1,448,062 | 13.80% | 199,890 | 19,404 | 14.73 | 29.50 |
| Ochota | 41 | 570,583 | 8.48% | 48,402 | 4,250 | 15.35 | 28.00 |
| Włochy | 68 | 556,873 | 16.89% | 94,067 | 5,276 | 14.27 | 26.00 |
| Ursynów | 39 | 259,993 | 10.89% | 28,321 | 286 | 13.92 | 23.00 |
| Praga-Południe | 24 | 172,239 | 4.18% | 7,191 | 1,617 | 14.99 | 28.00 |
| Wilanów | 12 | 118,092 | 1.43% | 1,683 | — | 16.32 | 26.00 |
| Praga-Północ | 22 | 85,598 | 2.50% | 2,143 | 234 | 22.92 | 26.24 |
| Żoliborz | 13 | 68,258 | 3.83% | 2,611 | 350 | 16.24 | 30.00 |
| Wawer | 9 | 32,489 | 9.30% | 3,022 | — | 13.47 | 16.00 |
| Białołęka | 8 | 30,978 | 5.20% | 1,610 | — | 15.82 | 22.50 |
| Targówek | 3 | 16,616 | 2.77% | 460 | — | 21.01 | 23.50 |
| Bielany | 3 | 12,320 | 3.41% | 420 | — | 14.64 | 22.00 |
Wola (5.39%) and Śródmieście (5.69%) are already a landlord's market. Mokotów (13.80%) and Włochy (16.89%) offer rents about 30% lower - the largest location arbitrage in Poland.
Supply and outlook: 1.9% of stock under construction
Development activity remains at a historic low: 128k sqm under construction against 6.67M sqm of stock. Almost all new supply is in Wola and the Centre - elsewhere the market will barely grow before 2028. So far in 2026, 18k sqm has been delivered, versus over 105k sqm in three Wola buildings in 2025 alone.
Under construction
| Building | Location | sqm | Delivery |
|---|
| Towarowa 22 - AFI Tower | Wola · A | 54,000 | 2028 |
| Upper One | Centre · A | 35,940 | 2027 |
| Skyliner II | Wola · A | 23,000 | 2026 |
| Towarowa 22 - Bldg E1 | Wola · A | 11,000 | 2027 |
| Soho - Mińska 39 | Praga · A | 3,074 | 2028 |
| Soho - B.55 | Praga · A | 1,300 | 2028 |
Recently delivered
| Building | Location | sqm | Year |
|---|
| Vena / Prymasa Office | Wola · A | 14,028 | 2026 |
| Puławska 533 | Ursynów · B | 4,000 | 2026 |
| The Bridge | Wola · A | 47,000 | 2025 |
| Towarowa 22 - Office House | Wola · A | 32,000 | 2025 |
| Studio A | Wola · A | 26,600 | 2025 |
Brookfield Partners perspective (H2 2026). We expect rents in the COB and Wola to keep rising gradually, and stabilisation in Służewiec and Włochy, where the incentive package will remain the main negotiating currency. For tenants with leases up to 2028 we recommend running renegotiation and a relocation scenario in parallel - competing options is the most effective lever to lower effective cost. As an adviser working exclusively for tenants, we do not represent landlords, so our recommendations are free of conflict of interest.
Methodology
The report is based on OfficeList Pulse data - Brookfield Partners' proprietary analytics platform monitoring 609 modern office buildings (Class A and B) in Warsaw; as of 10.06.2026. Rents: average asking rates weighted for available space; service charges: median of quoted advances. This material is for information only and does not constitute an offer within the meaning of the law; we recommend preceding any lease decision with an individual analysis.