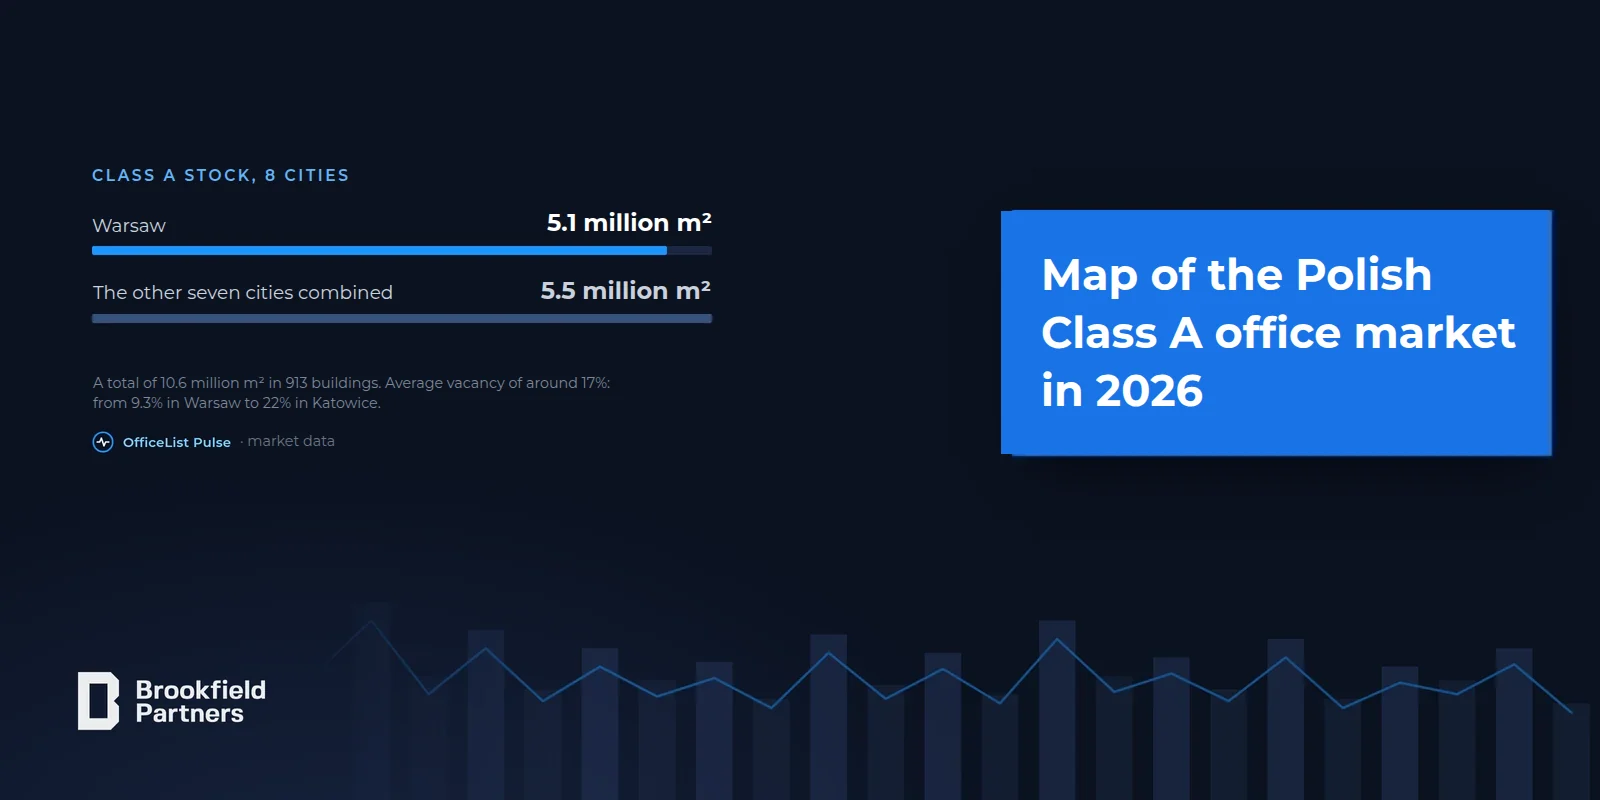

Poland's Class A office market totals 10.6 million m² in 913 buildings across 8 cities, with average vacancy around 17%. Warsaw holds 5.1 million m² at 9.3% vacancy and an average rent of 18.53 €/m². Warsaw and Poznań (10.9%) are tight, Kraków, Gdańsk and Gdynia moderate, while tenants have the most choice and strongest position in Wrocław, Katowice (22%) and Łódź, where rent of 11.28 €/m² is over 40% below Warsaw.
The Polish Class A office real estate market is a diversified ecosystem of 8 key cities. Understanding this market's structure – resources, availability, and prices – is critical for any tenant advisor making relocation or renegotiation decisions.
Below we present a complete map of the Polish Class A office market based on the latest 2025 data, with insights for 2026 forecasts.
City Ranking - Resources and Market Characteristics
| Rank | City | Class A Resources (m²) | Number of Buildings | Vacancy (%) | Characteristics |
|---|---|---|---|---|---|
| 1 | Warsaw | 5.1M | ~420 | ~9.3% TIGHT | Market leader, high prices, quality pressure |
| 2 | Kraków | 1.47M | ~130 | ~15.5% MODERATE | Fast-growing, top locations tight |
| 3 | Wrocław | 1.19M | ~105 | ~17.9% LIBERAL | Stable, more choice for tenants |
| 4 | Katowice | ~0.72M | ~65 | ~22% LIBERAL | High vacancy, negotiation room for tenants |
| 5 | Gdańsk | ~0.71M | ~60 | ~15-16% MODERATE | Growing hub, good prospects |
| 6 | Poznań | ~0.70M | ~55 | ~10.9% TIGHT | Tight market, fast absorption |
| 7 | Łódź | ~0.60M | ~50 | ~17.9% LIBERAL | Lowest rents (11.28 €/m²), greatest flexibility |
| 8 | Gdynia | ~0.20M | ~28 | ~12-14% MODERATE | Small market, high rents (15.72 €/m²) |
Warsaw - Poland's Market Leader
Resources and Structure
Warsaw maintains its dominant position with resources of 5.1M m² – nearly half of all Class A resources in Poland. The Warsaw market is mature, geographically diversified (Center, Southern Mokotów, East), and new project supply remains limited.
Price and Availability
Average rent is approximately 18.53 €/m², placing Warsaw in the middle of European benchmarks. A 9.3% vacancy rate means the market is tight – good locations disappear quickly.
For Tenants
If considering relocation in Warsaw, planning must be done 6-9 months in advance. Landlords' negotiating position is strong.
Kraków - Second-Largest, Rapidly Growing
Resources and Trend
Kraków, with 1.47M m² resources, is clearly the second player in the Polish market. Growing market with good pipeline of new projects, but rapid absorption.
Price and Availability
Vacancy of 15.5% is distributed unevenly – Center and South are tight (below 8%), other districts more liberal. This means averages can be misleading.
For Tenants
Top-tier locations are shrinking fast. If seeking premium space, action must be quick. If location flexibility is possible – you have negotiating advantage.
Second-Tier Triad: Wrocław, Katowice, Gdańsk
Wrocław (1.19M m²): Stable market with 17.9% vacancy. More options to choose from for tenants, better negotiating terms. Good for companies seeking flexibility.
Katowice (~0.72M m²): High vacancy (22%) gives tenants significant room for negotiation. If Silesia's central location is important for you, Katowice offers the best negotiating terms in Poland.
Gdańsk (~0.71M m²): Growing hub with moderate vacancy (15-16%). Good growth potential for companies forecasting port region development.
Smaller Markets: Poznań, Łódź, Gdynia
Poznań (~0.70M m²)
Though smaller than Kraków, Poznań has Poland's second-lowest vacancy (10.9%). Tight market, fast absorption. For tenants – plan ahead.
Łódź (~0.60M m²)
Greatest price flexibility in Poland. Class A rent is just 11.28 €/m² – over 40% cheaper than Warsaw. 17.9% vacancy provides capacity for new tenants. For cost-conscious companies – first choice.
Gdynia (~0.20M m²)
Smallest market, but with interesting characteristics: high rents (15.72 €/m²) with limited supply. Niche market, but strategically important for companies headquartered in Tri-City.
Vacancy - Availability Risk Mapping
Average Polish Class A market vacancy is approximately 17%. However, distribution is significant:
- Below 12% (tight markets): Warsaw, Poznań – good locations may be unavailable.
- 12-17% (moderate markets): Kraków, Gdańsk, Gdynia – reasonable availability with mixed negotiating positions.
- Above 17% (liberal markets): Wrocław, Katowice, Łódź – many options, strong tenant negotiating position.
Strategic Recommendations for Tenant Advisors
Scenario 1: Company Seeking Best-in-Class
If you want absolute best location, Class A+ with ESG certifications – you must act fast and be price-flexible. Warsaw, top-tier Kraków and Poznań locations are options, but at high cost. Plan minimum 9 months ahead.
Scenario 2: Company Optimizing Costs
Łódź and Katowice offer best price-to-quality ratio. Wrocław provides balance between price and location prestige. Here you have negotiating advantage.
Scenario 3: Company Seeking Flexibility
All cities except Warsaw and Poznań offer reasonable flexibility. Ability to choose between several options, negotiate technical conditions, fit-outs, free periods.
2026 Forecast
Assuming current absorption trends:
- Warsaw and Poznań will tighten further – vacancy may drop below 9%.
- Kraków will remain tight in centers, but peripherally still liberal.
- Wrocław and Katowice will maintain moderate availability.
- Łódź will remain flexible market with best prices.
Summary
Poland's Class A office market is not one market, but eight distinct micromarkets, each with different dynamics. For tenant advisors, key is understanding these differences and adapting strategy to specific location and client needs.
Brookfield Partners, as tenant advisor, helps companies navigate this complexity, ensuring every location decision is aligned with actual business needs, not market pressure.